Related blog posts with changelogs and demo videos:
Telemetry Viewer v0.9
December 23, 2025
Telemetry Viewer v0.9 Changelog (2025-12-23)
New features:
Telemetry Viewer is now packaged as an EXE for Windows, or a RUN file for Linux (x64) or Raspberry Pi (aarch64.) You no longer need to worry about Java versions or command line flags.
Devices are now detected when attached or detached, optionally showing a notification when that happens.
A connection that has failed (disconnected cable, etc.) can automatically try to reconnect.
The sample rate of a telemetry stream is now calculated automatically (or you can specify it manually.)
Most GUI widgets were redesigned to be more intuitive, more compact, and more touchscreen friendly.
If a settings file named "default.txt" is placed in the same folder as Telemetry Viewer, it will be automatically imported when running Telemetry Viewer.
Axis divisions and plot tooltips now show units, and SI prefixes are used instead of exponential notation.
Axis divisions and plot legends can now be drawn in a more compact way, allowing the plot to occupy a larger portion of the screen.
The FPS can be limited, which reduces CPU/GPU load (particularly helpful for laptops that get hot or have a short battery life.)
Example firmware/software for sending telemetry is now provided for every type of telemetry connection, in the form of Arduino/ESP32 and Java code.
Transmitting is now supported for TCP and UDP connections.
Added a widget for specifying the display scaling factor (previously it only worked via keyboard shortcut.) It is now saved as part of the settings file and will be restored when imported.
Replaced the webcam library with my own library. The supported resolutions, frame rates and codecs are now shown. If a camera has adjustable settings (focus, exposure, zoom, etc.) they can now be adjusted. Cameras are currently only supported on Windows.
Settings for network cameras (MJPEG over HTTP) can now be adjusted if you use the IP Webcam or IP Webcam Pro Android app.
Timelines can show image previews when hovering over the timeline.
Triggering now works when rewinding or time shifting.
Triggering can now trigger on bitfield states.
Widgets for selecting Bitfield events have more intuitive icons.
Number formatting for the charts and tooltips is now more consistent.
Frequency Domain chart autoscaling can ignore outliers.
Frequency Domain charts in histogram or waterfall mode can now specify a gamma, making it easier to see rare events.
Frequency Domain charts in histogram or waterfall mode can now autosize the x-axis and y-axis bins.
Performace improvements:
Importing is faster.
Exporting is faster.
Histogram charts are faster.
JPEG encoding/decoding on Windows is faster.
Frequency Domain charts are much faster.
Adjusting the display scaling factor is much faster.
Bitfield rendering is much faster, and bitfield tooltips now render along the top of a chart (making them more readable.)
Webcams are faster, especially if they are high resolution or high frame rate.
Various small bug fixes. See the git commit log for more details.
Basic triggering was added for time domain charts. It works like an oscilloscope: trigger on a rising edge, falling edge, or both edges. The usual trigger modes are supported: auto, normal and single.
The timeline now has a full set of playback controls. You can jump to the beginning, jump to the end, play, pause, and rewind. Playback and rewinding speed can be adjusted from 1x to 8x.
Cameras are now managed like regular connections, and exporting them creates standard MKV files. The MKV files can be played back in common movie players like VLC, or they can be imported back into TelemetryViewer. The benefit of playing them with TelemetryViewer is that the timestamps for each frame are displayed on screen.
Exporting is much faster now and the exporting process can be canceled.
Added support for the RDTech TC66/TC66C USB-C power meters. They are available here: https://amzn.to/3l6QFYD
Added a "Statistics Chart" which can calculate and display the minimum/maximum/mean/median/standard deviation/90th percentile. The chart can also be used as a simple numeric display (showing just the current value of a dataset.)
Transmitting to UARTs is now supported. Data can be specified in text/hex/binary forms. Data can be sent once or repeatedly, and the data can be bookmarked for later use.
"Test Mode" has been renamed to "Demo Mode" to make what it does more obvious. New waveforms were added to help demonstrate trigger functionality.
Massive speed improvements were made in the data processing logic, and a "Stress Test Mode" was added to benchmark it. A modern laptop can process and visualize telemetry at speeds over 5Gbps.
For binary mode, the sync word is now optional and its value can be specified. Example Java code is also provided for binary mode UDP connections.
Notifications are now drawn with OpenGL, resulting is much smoother animations. They now slide into or out of existence. The different notification categories can be enabled or disabled, and their colors can be changed.
Replaced the color picker with an easier and simpler design.
Benchmarking now profiles every chart on screen instead of just one.
Added support for uint32 binary datasets. Note that samples are processed and stored into float32's, so the full range of uint32 samples can not be perfectly represented.
Lots of minor changes to improve the user experience. Some of the textboxes now shows units to make things more obvious, and some dropdown boxes were replaced with button groups to require one less click from the user.
Various small bug fixes. See the git commit log for more details.
Java 16 Notes
Java 16 was recently released and made some changes to how the internal APIs work. The OpenGL library that I use interacts with some of those internal APIs, and an updated version that is compatible with Java 16 has not been released yet. As a work around, if you use Java 16 you must run the .jar file from the command line with a special flag:
This work around also applies to older versions of Telemetry Viewer when using Java 16.
Java 16+ Notes
Java 16 made some changes to how the internal APIs work. Java 17 then made further changes. The OpenGL library that I use interacts with some of those internal APIs, and an updated version that is compatible with Java 16 or newer has not been released yet. As a work around, if you use Java 16 or newer you must run the .jar file from the command line with some special flags:
Webcams and network cameras (MJPEG over HTTP) are now supported.
Initial support for the Raspberry Pi 4 (currently does not support antialiasing or cameras.)
A new "timeline" feature makes it easy to jump or scrub through lots of data.
Time domain charts can now show timestamps (date and time) along the x-axis.
Bitfield (boolean and enum) "levels" can now be visualized as bars drawn on top of the charts (similar to a logic analyzer.)
Timestamps can be shown in any of the common formats: YYYY-MM-DD, MM-DD-YYYY and DD-MM-YYYY.
Most of the OpenGL and chart code has been rewritten, resulting in massive speed improvements. CPU and GPU usage is often cut in half. When using Nvidia GPUs the GPU usage has been cut down by almost 80%!
Progress bars are now displayed when importing and exporting data.
Added support for Java 9+ (still works with Java 8.)
Various small bug fixes. See the git commit log for more details.
Raspberry Pi Notes
Telemetry Viewer will only work on the Pi 4. Older Pi's don't support some of the OpenGL ES features that are required, and implementing those features on the CPU would be slow.
The Pi 4 GPU is supposedly capable of OpenGL ES 3.2, but the drivers only fully support ES 3.1 and partially support ES 3.2. Telemetry Viewer requires "geometry shaders" which are part of ES 3.2.
As of today, the version of Mesa included in "Ubuntu MATE 20.04 Raspberry Pi 32-bit" supports geometry shaders, but the version of Mesa in "Raspberry Pi OS" does not. If you use Ubuntu, all you need to do is install Java ($ sudo apt install default-jre) and you are ready to use Telemetry Viewer.
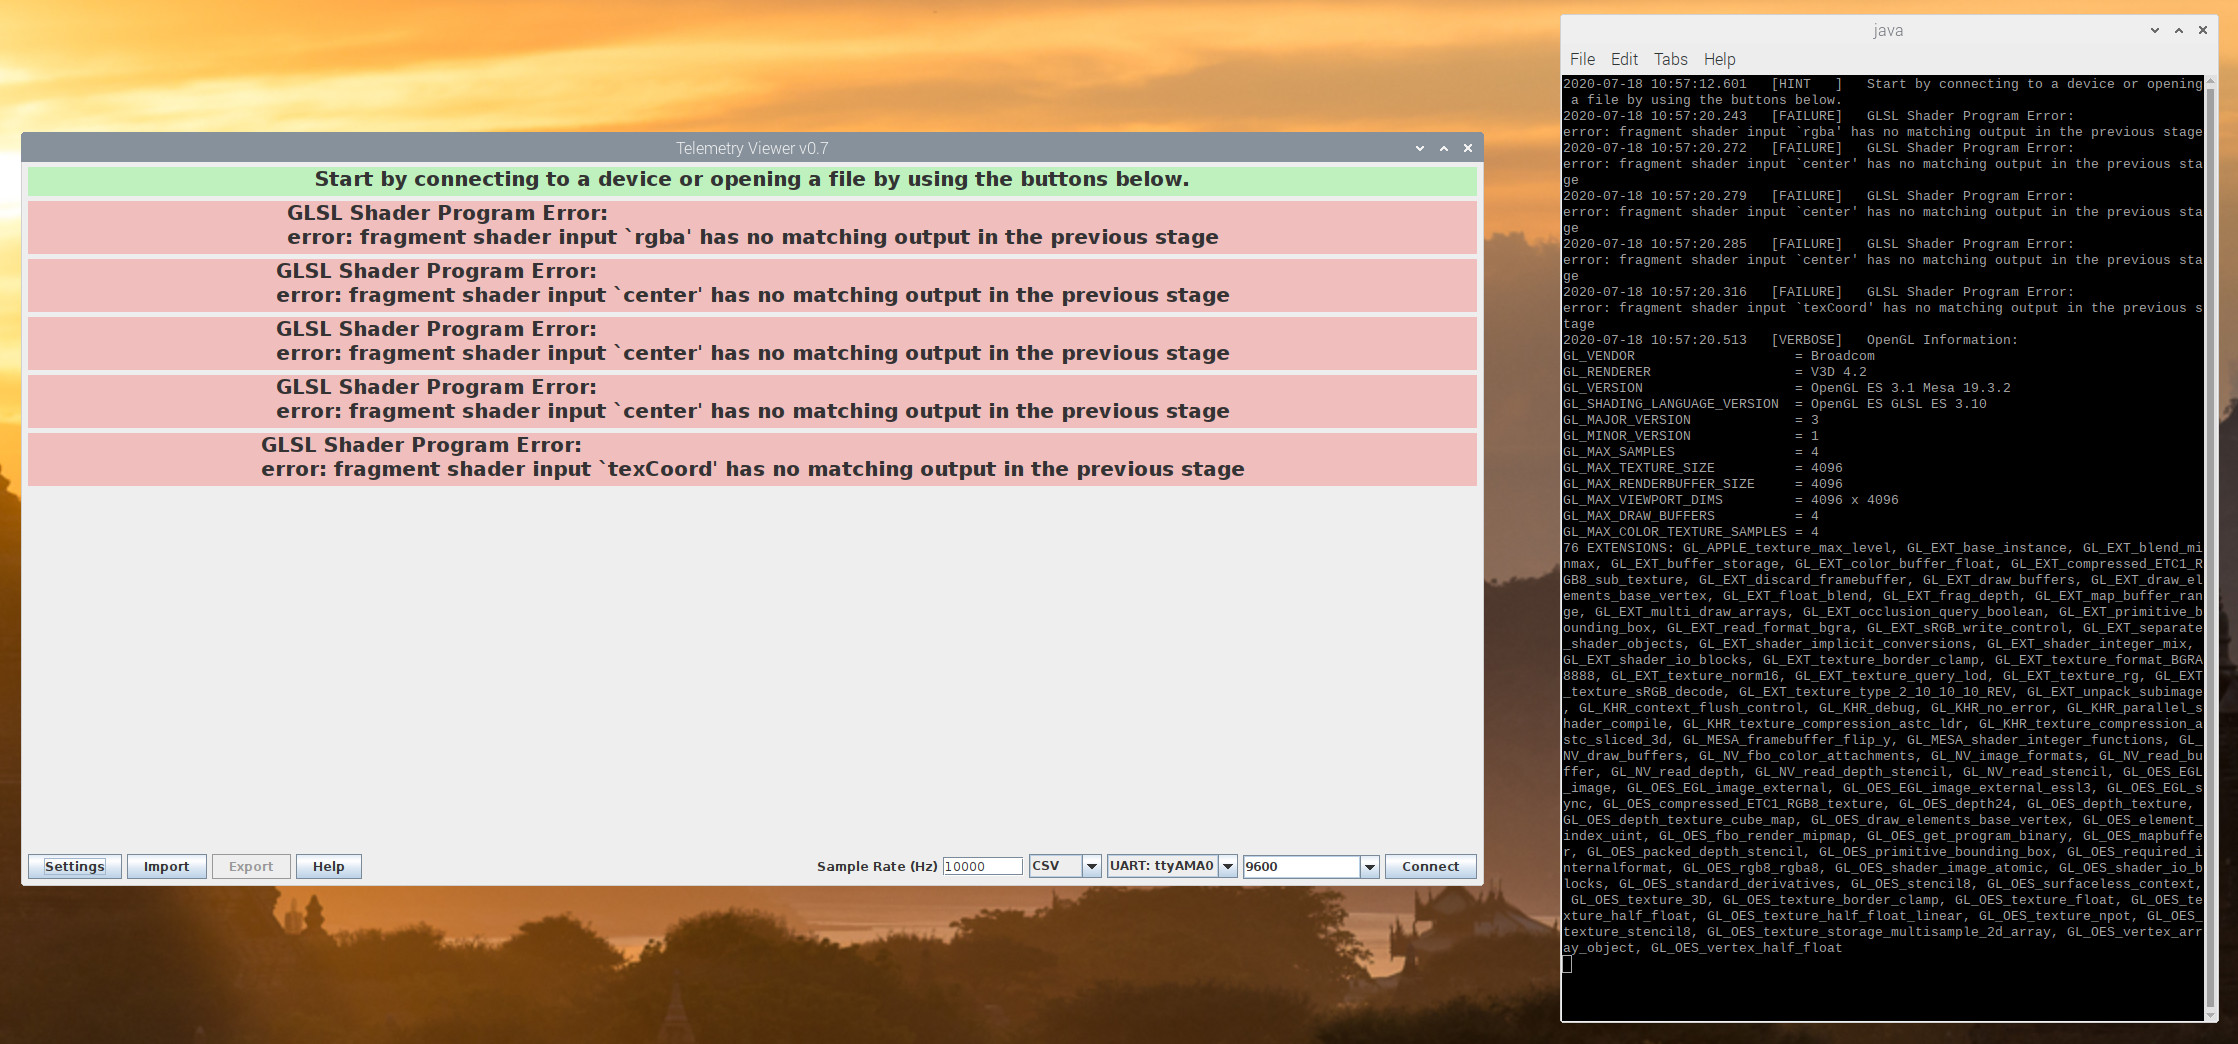
If you want to use Raspberry Pi OS, try running Telemetry Viewer. Maybe you'll get lucky and by the time you read this an updated Mesa will already be in Raspberry Pi OS.
If you get GLSL errors (like the screenshot above) you will need to download Mesa from their git repo, then compile it and install it. You will also need to set an environment variable every time you want to run Telmetry Viewer. I do not recommend this for beginners, but here is how I got it working:
$ sudo pip3 install meson mako
$ sudo apt install libdrm-dev llvm bison flex libxext-dev libxdamage-dev libxcb-glx0-dev libx11-xcb-dev libxcb-dri2-0-dev libxcb-dri3-dev libxcb-present-dev libxshmfence-dev libxxf86vm-dev libxrandr-dev ninja-build
$ git clone https://gitlab.freedesktop.org/mesa/mesa.git
$ cd mesa
$ nano meson_options.txt
    set platforms to ['drm', 'x11', 'surfaceless'] and set gallium-drivers to ['kmsro', 'v3d', 'vc4', 'swrast']
$ mkdir build
$ cd build
$ meson ..
$ sudo ninja install
To run Telemetry Viewer you will need to set an environment variable to select the new Mesa you just installed: